ISSN
ISSN 


-
2010年全球近视人群约有19.5亿,占世界总人口的28.3%[1]。2018年我国儿童青少年总体近视率为53.6%[2],远超国际水平[3]。目前美国[4-5]、新加坡[6-7]、澳大利亚[8]等国家已采用队列研究的方法对儿童近视影响因素展开研究。国内也有不少针对中国各城市青少年近视情况的分析,如上海[9-10]、安阳[11]、广州[12]、温州[13]、北京[14]等。文献[15]分析了来自Orinda近视纵向研究的数据子集MYOPIA,认为父母近视情况、户外运动时间、阅读时间和性别等因素对近视有较大影响。Orinda近视纵向研究[15-17]、CLEERE父母近视史的研究[18]以及近视影响因素研究[19]都认为青少年早期屈光度能够用于预测其未来近视的发生。文献[20]分析了长达10年的临床屈光数据,发现机器学习方法可以有效预测高度近视发生的几率。
现有研究中使用最多的方法为队列分析和逻辑回归[21]。其中队列研究是探讨疾病病因的常用方法之一,能较好地揭示两事件间的因果关系。但设计和组织实施较难,收集与分析资料较复杂。逻辑回归分析其决策面是线性的,难以处理数据不平衡的问题。本文利用斯皮尔曼相关系数(spearman's rank correlation coefficient)[22]分析各影响因素与未来视力的相关性,并细分高度近视与普通近视随年龄的变化情况。斯皮尔曼相关系数是衡量两个变量的依赖性的非参数指标,利用单调方程评价两个统计变量的相关性,适用于总体分布未知或有序变量相关性分析。本文构建了适用于小数据集和一次检查数据的集成学习算法模型,仅需输入一次检查数据即可对未来任意时刻视力情况进行量化预测。通过对比5种常见的集成学习算法,发现随机森林模型的综合表现最佳。本工作在近视预测及防控方面具有一定的参考价值。
-
根据2019年10月15日国家卫健委办公厅印发的《儿童青少年近视防控适宜技术指南》,近视率指近视人群的占比,而筛查近视的标准为裸眼视力低于5.0,且非睫状肌麻痹情况下电脑验光等效球镜(简写为SE,后均指在非睫状肌麻痹情况下进行的检查)度数小于−0.50D,其中等效球镜度数为球镜度数加上1/2倍柱镜度数。在已判断为近视的人群中,近视程度划分标准如下:1) 低度近视——SE度数在−3.00D~−0.50D(含)之间;2) 中度近视——SE度数在−6.00D~−3.00D(含)之间;3) 高度近视——SE度数小于−6.00D。
本文分析了3个视力检查数据集。其中数据集A和B来自艾视医疗科技成都有限公司(简称艾视科技)2019年6月−2020年7月成都市3~16岁用户双眼近视检查,包含性别、年龄、球镜、柱镜、裸眼视力、等效球镜、是否近视等数据项。已经排除了近期有眼部活动性病变者和近期配戴接触镜者的对应数据。数据集A中每个用户仅有一次检查数据,共19 467条。纳入的研究对象平均年龄(9.23±2.55)岁,男性10 137例,占52%,女性9 330例,占48%。左眼等效球镜平均(−0.79± 1.75)D,右眼等效球镜平均(−0.90±1.76)D,左眼裸眼视力平均 (4.8±0.32),右眼裸眼视力平均(4.78±0.33)。裸眼视力采用五分记录法。整体近视率为41.1%。其中近视程度为不近视、低度、中度、高度的分别占比58%、28%、12%、2%。数据集B中每个用户有两次检查数据,共1 470条、735对。纳入的研究对象平均年龄(8.42±2.23)岁,男性748例,占51%,女性722例,占49%。左眼等效球镜平均(−0.21±0.89)D,右眼等效球镜平均(−0.26±0.9)D,左眼裸眼视力平均(0.96±0.22),右眼裸眼视力平均(0.97±0.24)。裸眼视力采用小数记录法。同一个检查对象两条数据之间的间隔时间从30~180天不等。第一次检查时整体近视率为19.6%。第二次检查时整体近视率为32.0%。第一次检查未近视的样本中有15.4%在第二次检查时变为了近视。数据集C来自Orinda近视纵向研究数据子集,每年由父母或监护人完成一次调查,包括调查对象视力检查数据以及年龄、近视家族史和相关视觉活动时间数据。本文使用的部分来自618名进入研究时并非近视受试者的初次检查结果。数据均来自对象的右眼。纳入的研究对象中男性302例,占49%,女性316例,占51%。其中年龄平均(6.3±0.71)岁,每周户外活动时间平均(11.95±7.96) h,每周阅读时间平均(2.8±3.07) h,每周电脑使用时间平均(2.11±3.05) h,每周学习时间平均(1.49±2.11) h,每周看电视时间平均(8.95±5.71) h。其中户外活动、阅读、使用电脑、看电视和学习时间仅统计校外活动。该数据集样本的近视率为13.1%,所有近视对象均为低度近视。
-
本文分析了性别和近视以及高度近视发生的关系,发现在我国的数据中,性别和近视发生无显著的关联关系,故后文不以性别为影响因素。图1给出了根据数据集A得到的不同年龄段近视发生率:深色代表近视人数,并用数字标识;浅色代表非近视人数;曲线给出了不同年龄的近视率。其中6岁以下及14岁以上数据量较小,故未计算其所对应的近视率。由图可见,6~14岁随着年龄的增长,近视率逐渐升高,到14岁时近似率已经接近80%,远远超过世界平均水平。
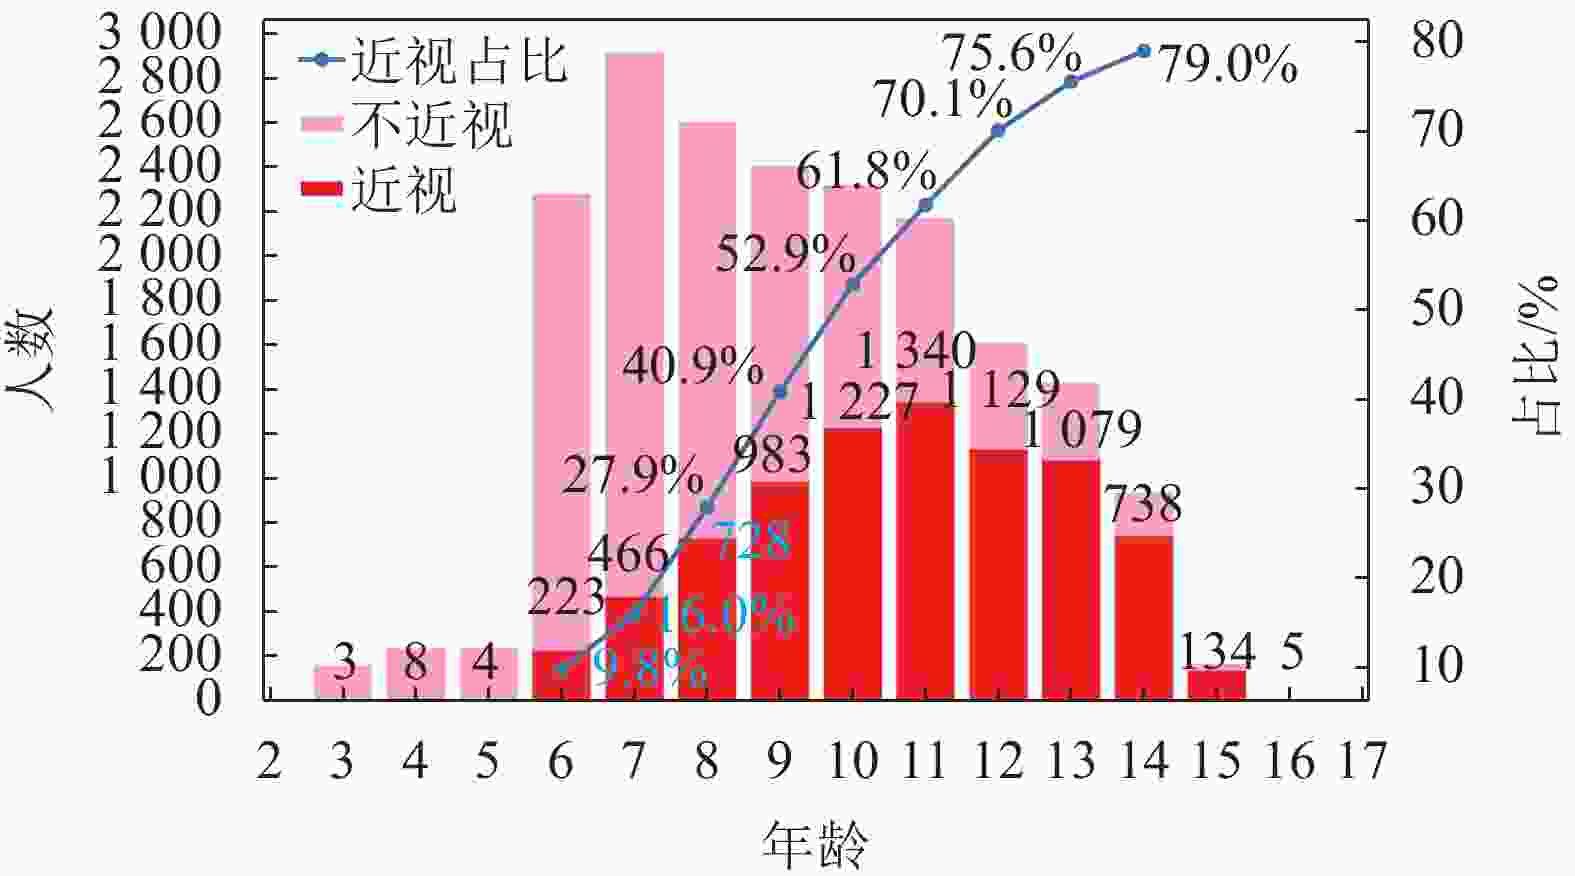
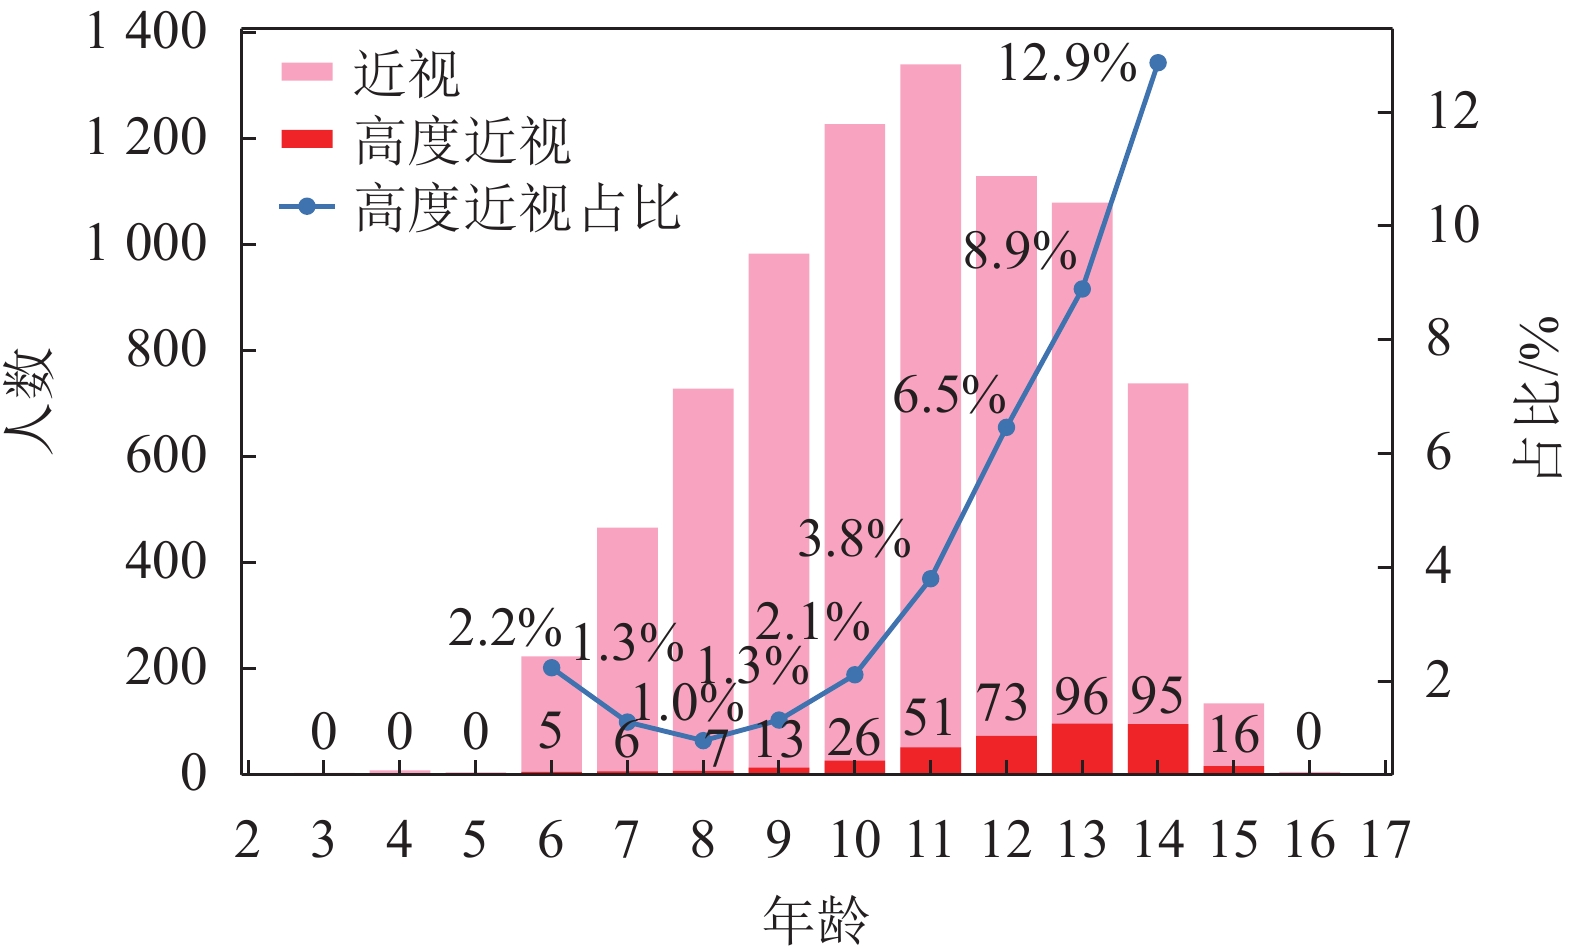
图 1 数据集A中不同年龄的近视情况
为分析近视人数增长情况,本文计算了不同年龄的近视转化率
$a(t) = {{[p(t + 1) - p(t)]}/{[1 - p(t)]}}$ ,其中p(t)是年龄为t的孩子中的近视率,a(t)表示有多少比例在年龄为t时还不是近视的孩子恰在这一年转化为近视。根据数据集A,孩子在6~13岁的近视转化率分别为6.87%、14.22%、17.94%、20.38%、18.77%、21.89%、18.20%和14.14%。从转化率分析可以看到,8~12岁是近视新增的高发时期,平均每年约有20%的非近视学生转为近视学生,13岁以后每年从非近视转化为近视的风险开始显著下降。图2给出了根据数据集A得到的不同年龄段高度近视发生率:深色代表高度近视人数,并用数字标识;浅色代表非高度近视人数;曲线给出了不同年龄的高度近视率。其中6岁以下及14岁以上数据量较小,故未计算其所对应的高度近视率。由图可见,高度近视的占比随年龄的增长而不断增长。从8岁开始高度近视率显著提升,且随年龄的增长逐渐升高。类似地,本文计算了不同年龄的高度近视转化率,从6~13岁分别为−0.98%、−0.33%、0.36%、0.81%、1.72%、2.77%、2.60%和4.36%。其中在6岁和7岁出现负数,可能有两个原因,一是因为数据量太小造成统计上波动太大,二是有一些遗传性的眼病导致极年幼就出现高度近视,这部分孩子的增长规律与其他孩子有所不同。随着未来数据量的增长,可以得到统计上更可信的结果。与此同时,8岁以后高度近视占比的增长非常显著,且10~14岁是高度近视快速增加的高危时期。14岁以上孩子数据较少,留待以后分析。
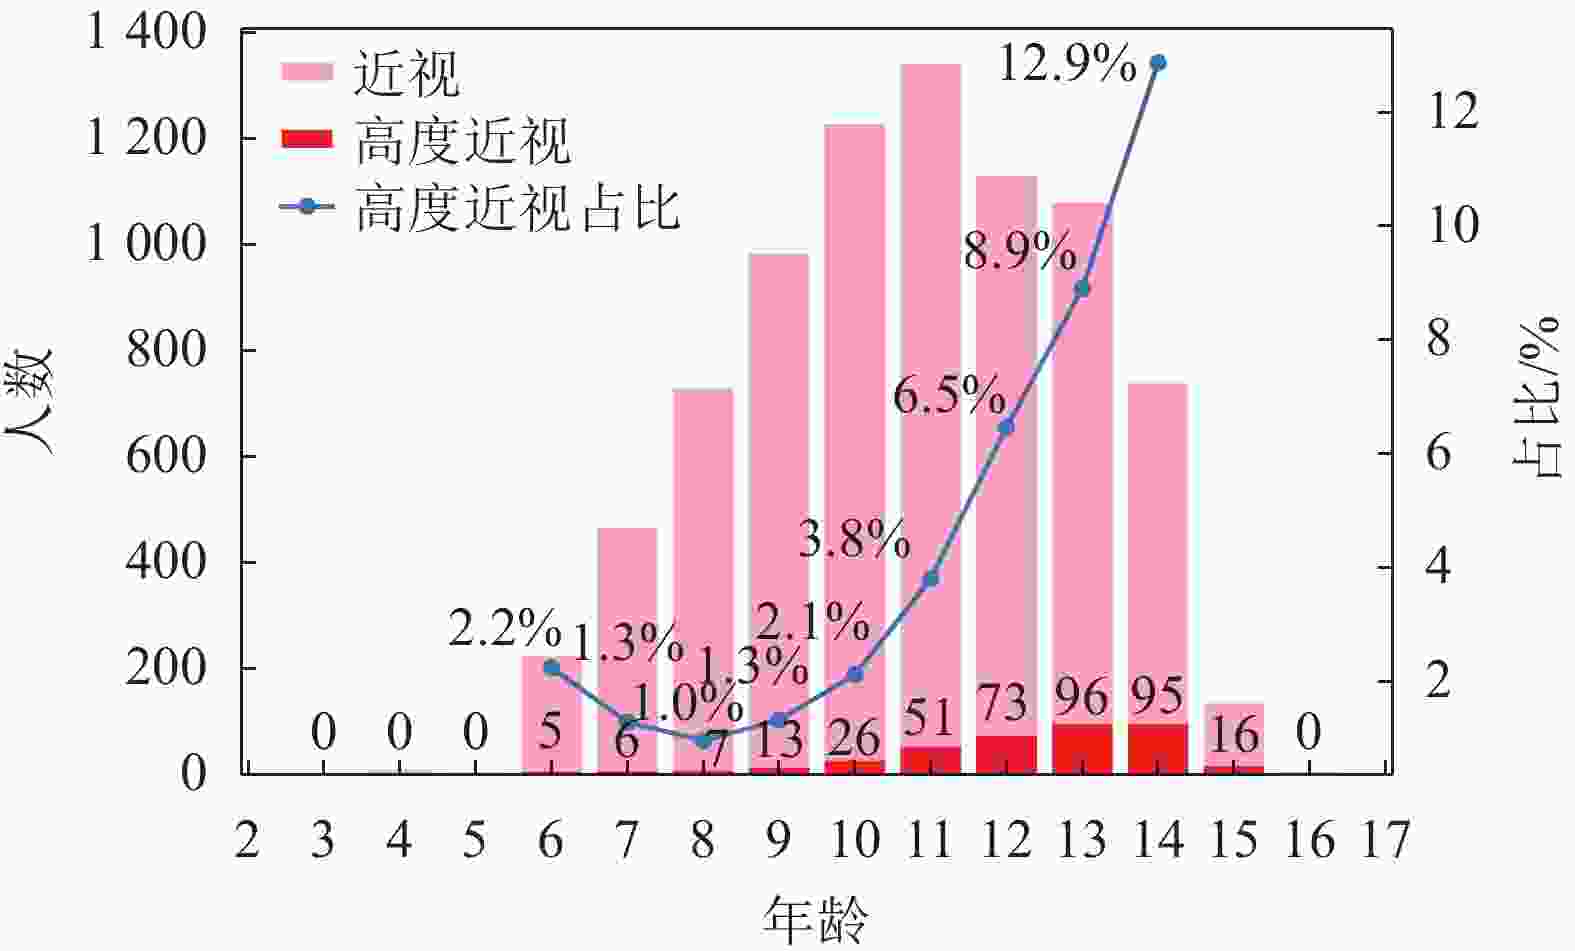
图 2 数据集A中不同年龄的高度近视情况
本文计算了数据集C各数据项与“近视与否”的斯皮尔曼相关系数,并做双尾检验。数据结果显示,父亲是否近视、母亲是否近视和每周户外活动时间与“近视与否”有显著影响(98%置信度水平上显著),其余各项(包括阅读、使用电脑、看电视和学习)在98%置信度上均无显著影响。
图3给出了父母近视与否对孩子近视情况的影响。父母中有一人近视时孩子的近视率为13.2%,是父母均不近视时的4倍,父母均近视时孩子的近视率为22.3%,为父母均不近视时的6.75倍。可见遗传对于近视影响是巨大的。
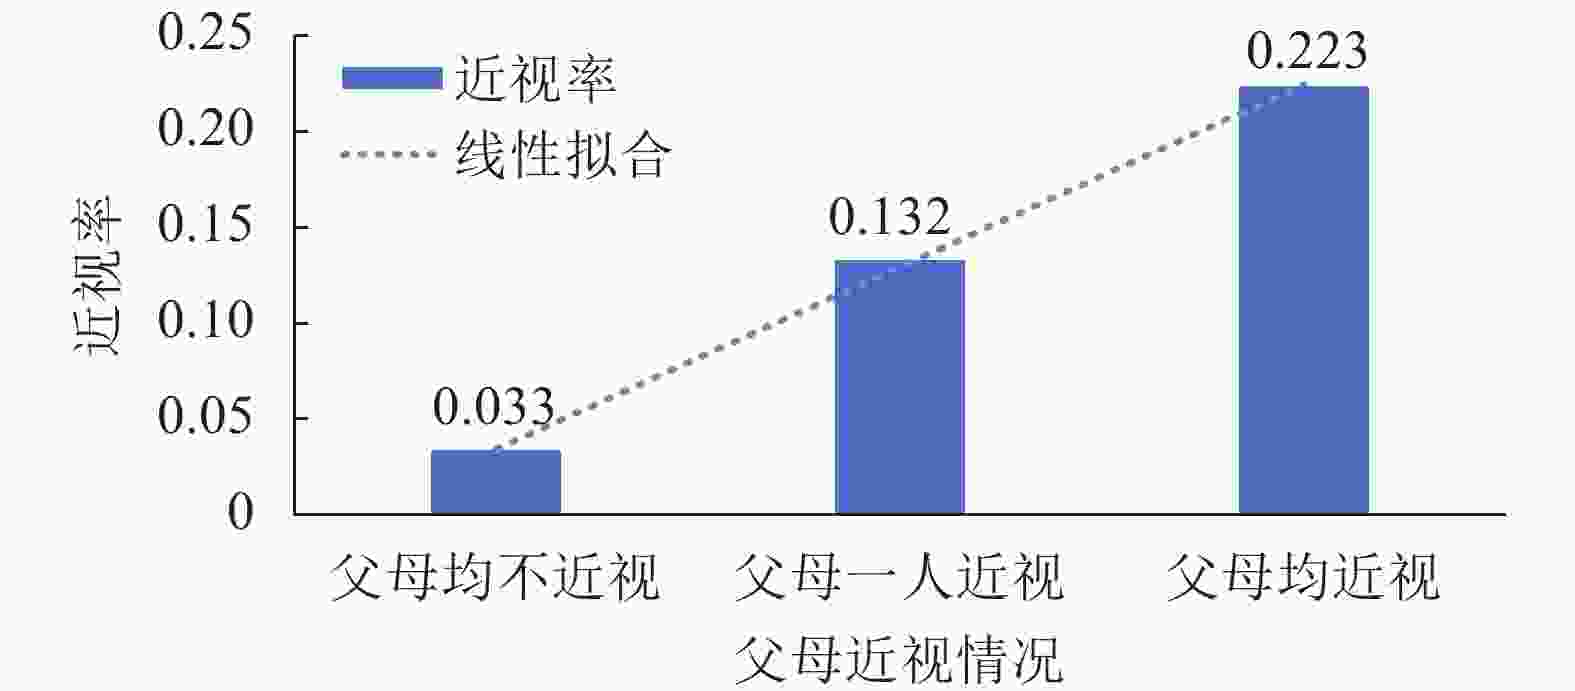
图 3 父母是否近视对孩子近视与否的影响
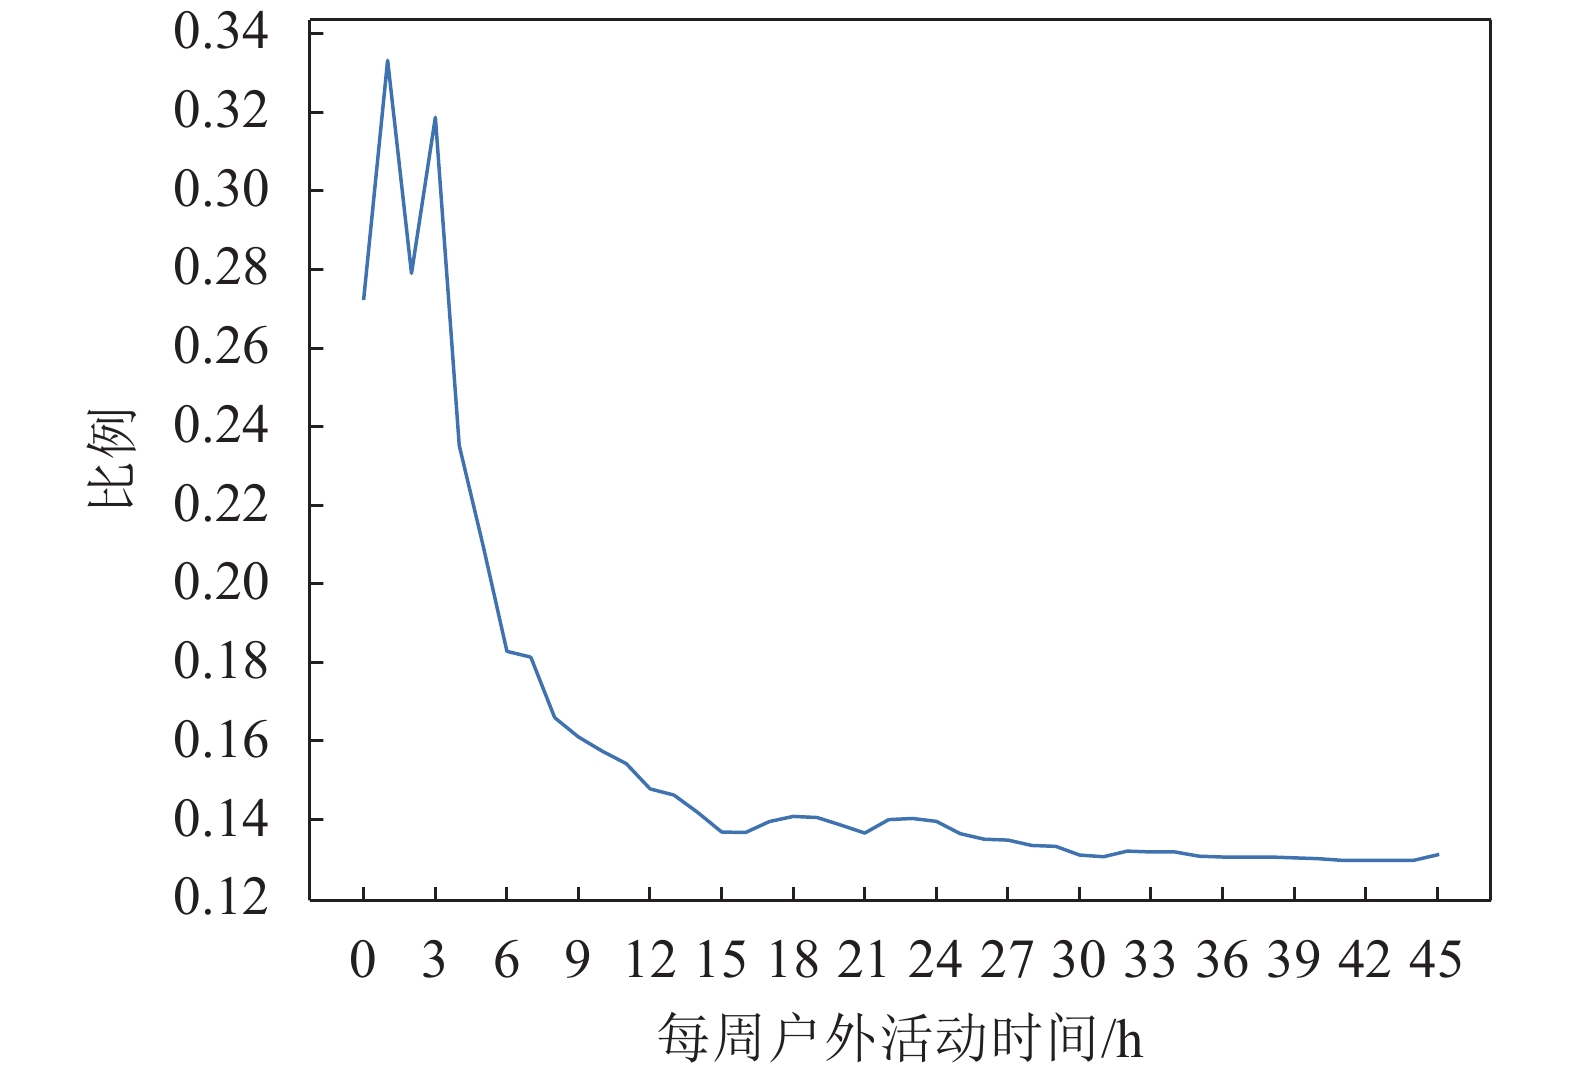
图4给出了每周户外活动时间和近视率的关系,其中统计在内的只包括离开学校后的户外活动。由图可知,除了曲线前部因为样本数量少出现波动外,整个曲线是近似单调的——户外活动时间越长,近视比例越低。在4 ~9 h区间内,增加户外活动时间带来的近视率的降低尤为显著。当每周户外活动时间大于15 h的时候,近视率不再显著变化。
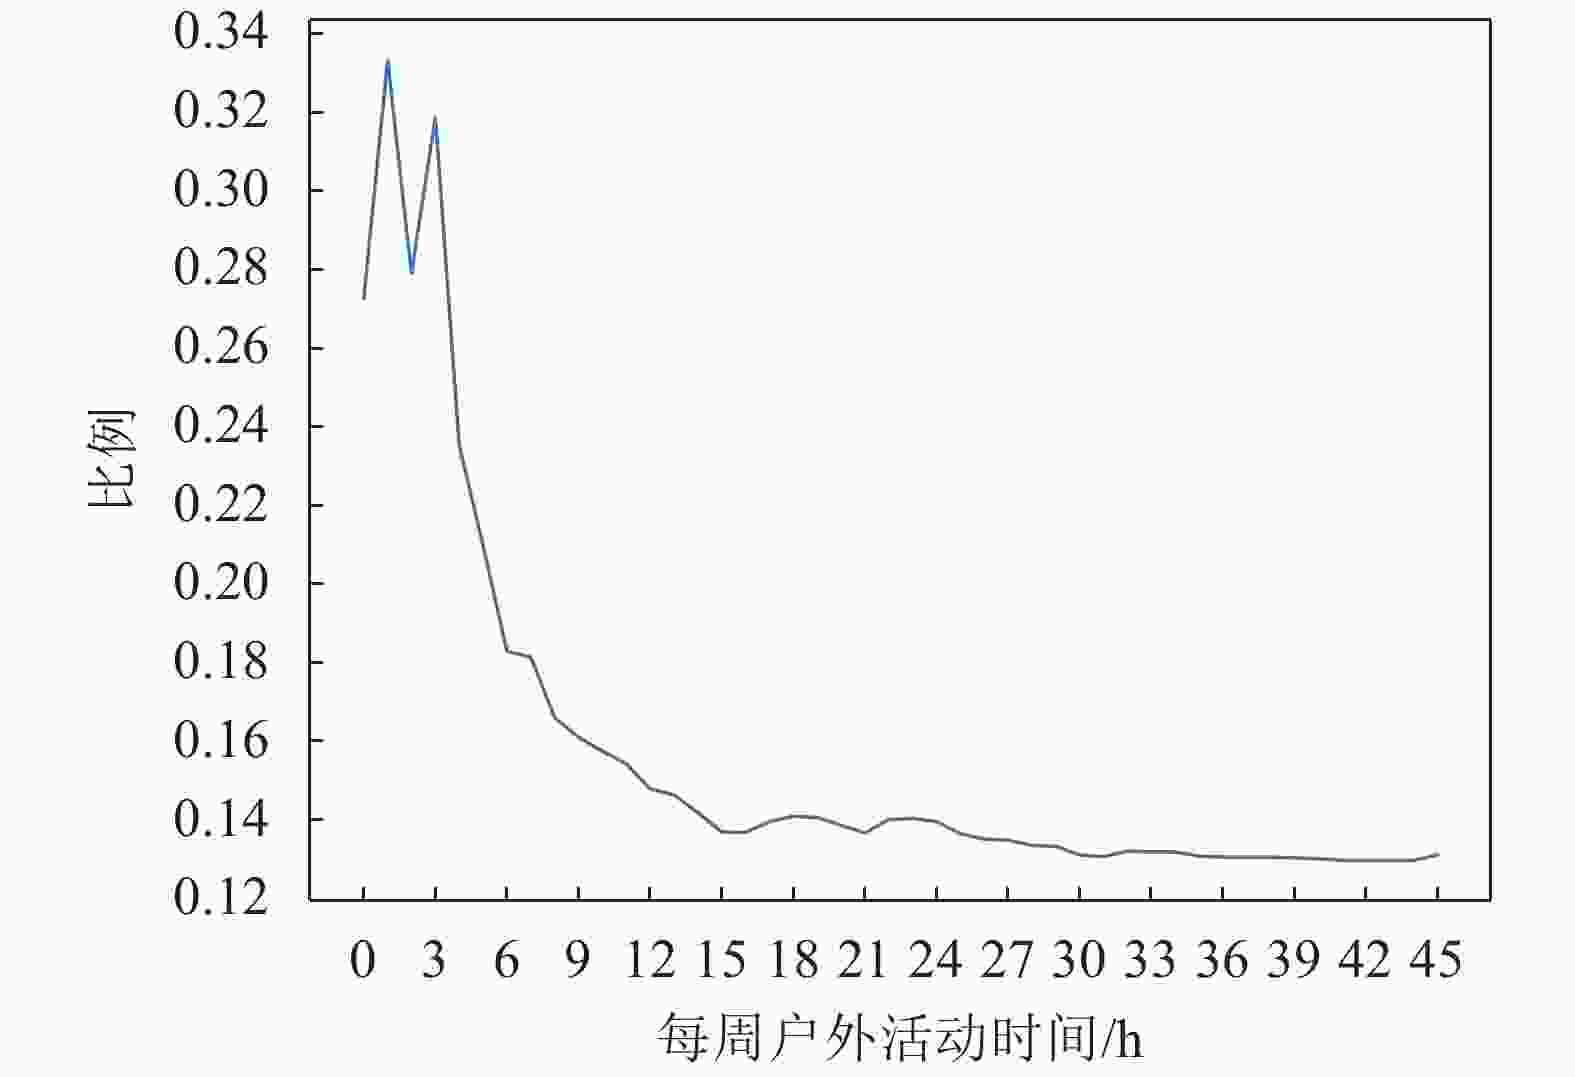
图 4 每周户外活动时间和近视率的关系。其中纵坐标给出的是每周户外活动时间不超过给定值的情况下近视的比率
-
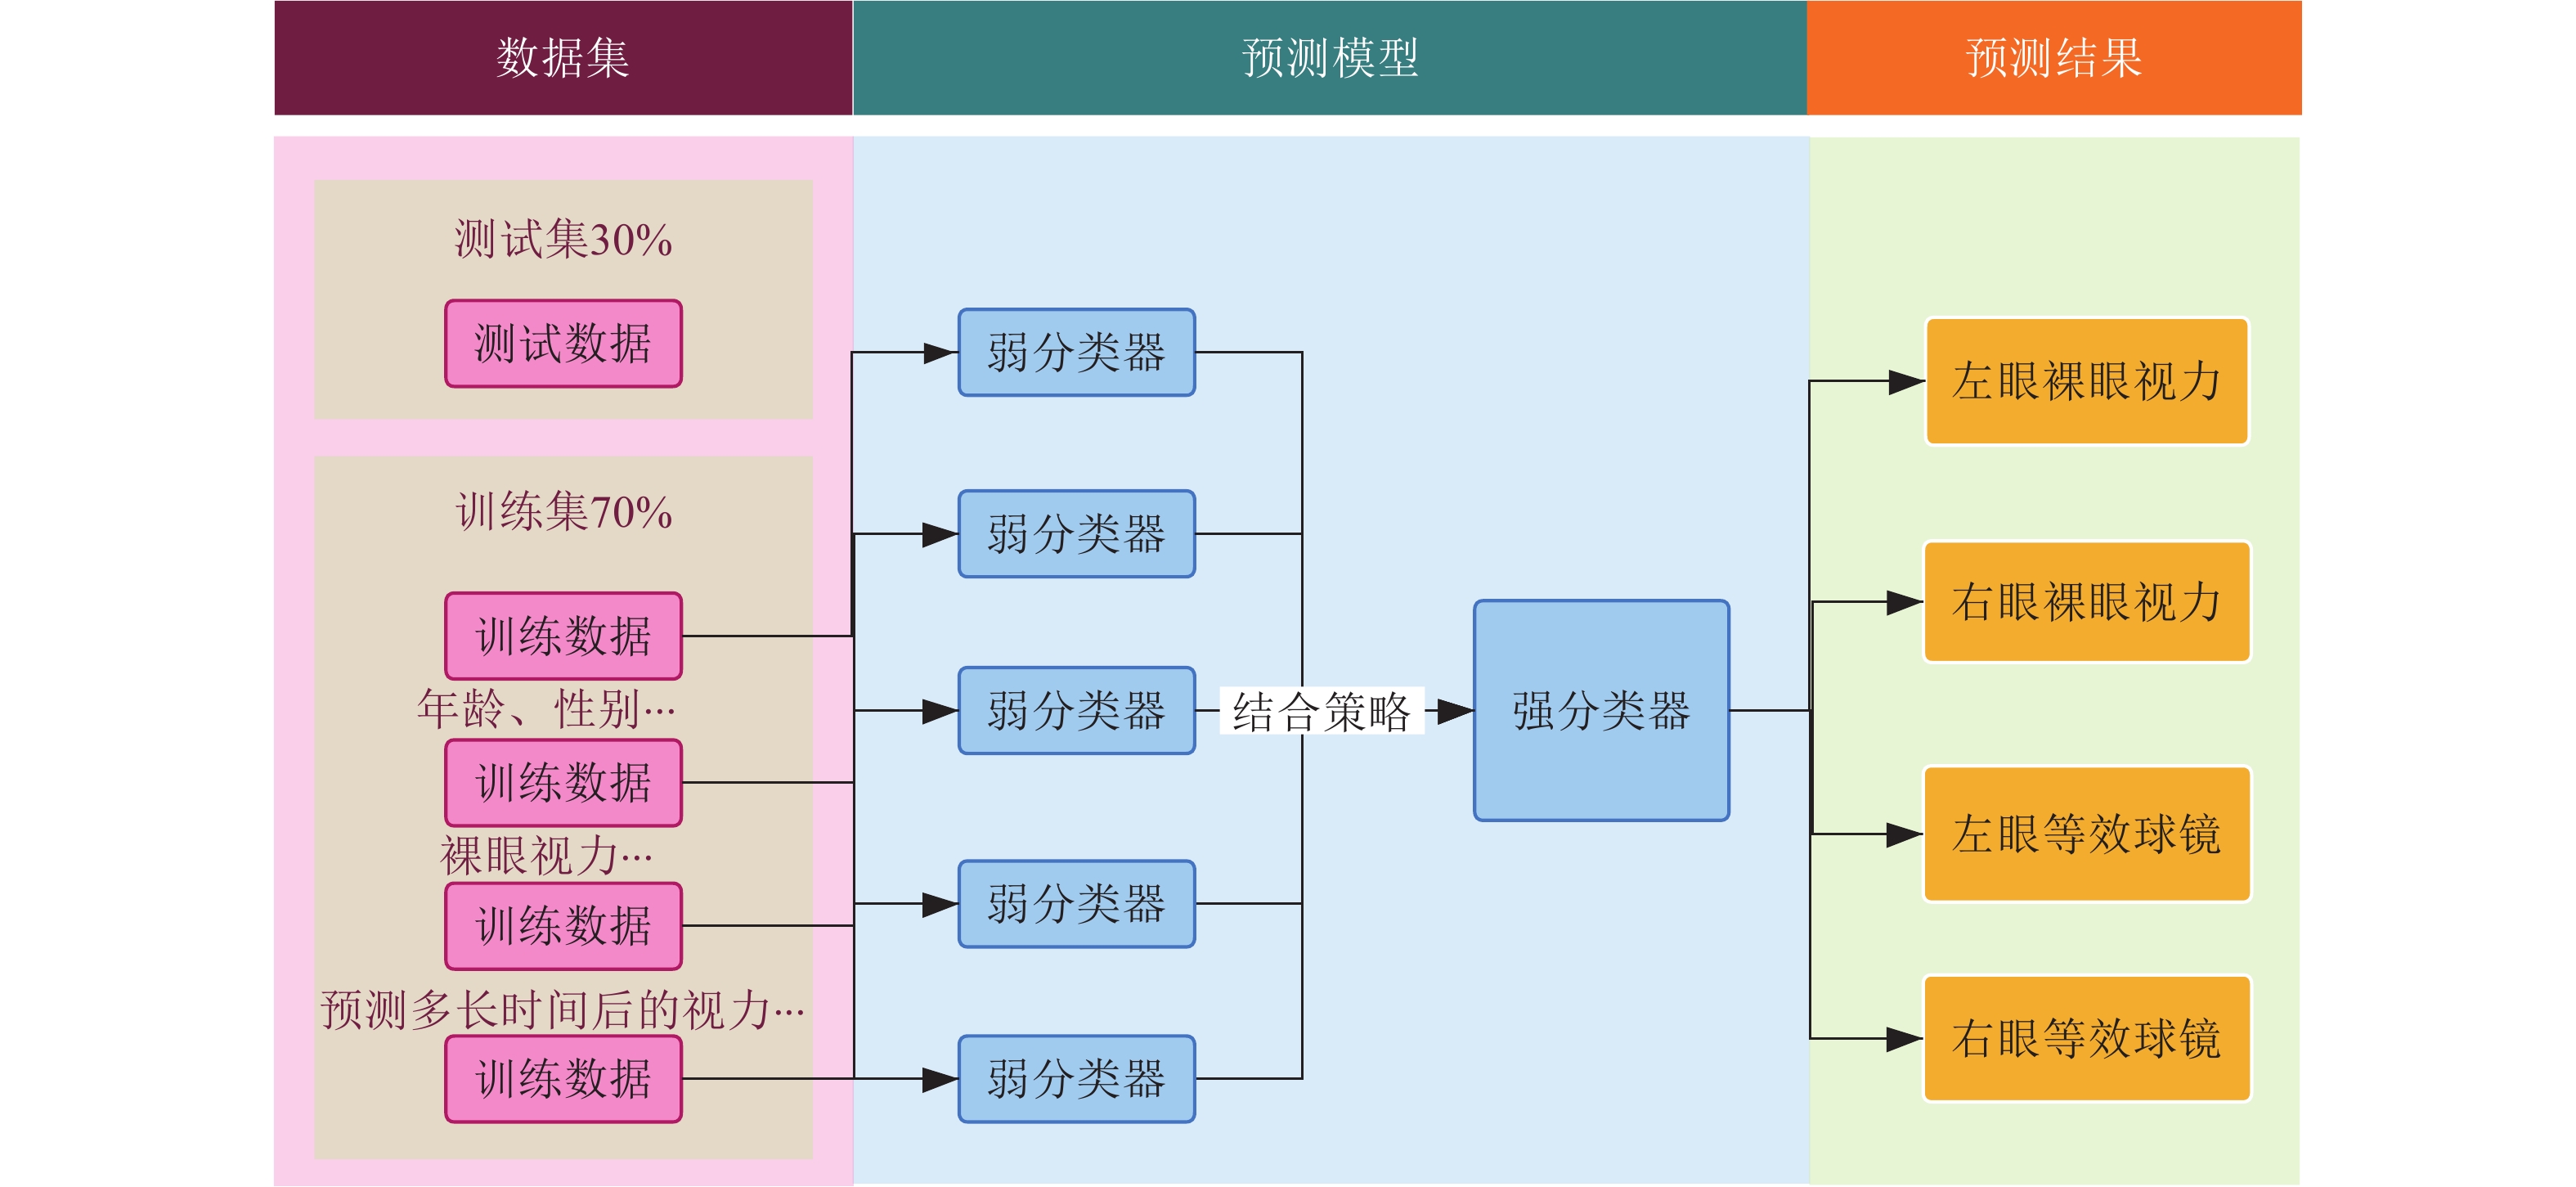
本文选取了随机森林(random forest)[23]、自适应提升(AdaBoost)[24]、装袋(bagging)[25]、梯度提升(gradient boosting)[26-27]和极端梯度提升(XGBoost)[28]5种集成学习模型,把数据集B中同一个检查对象的前一个时间点数据(含个人信息)和间隔时间一起作为训练数据,预测其后一个时间点的近视情况。样本数据随机划分为70%训练集和30%测试集,预测对象为裸眼视力和等效球镜,并用预测值与真实值差的绝对值作为误差。预测模型的结构如图5所示。
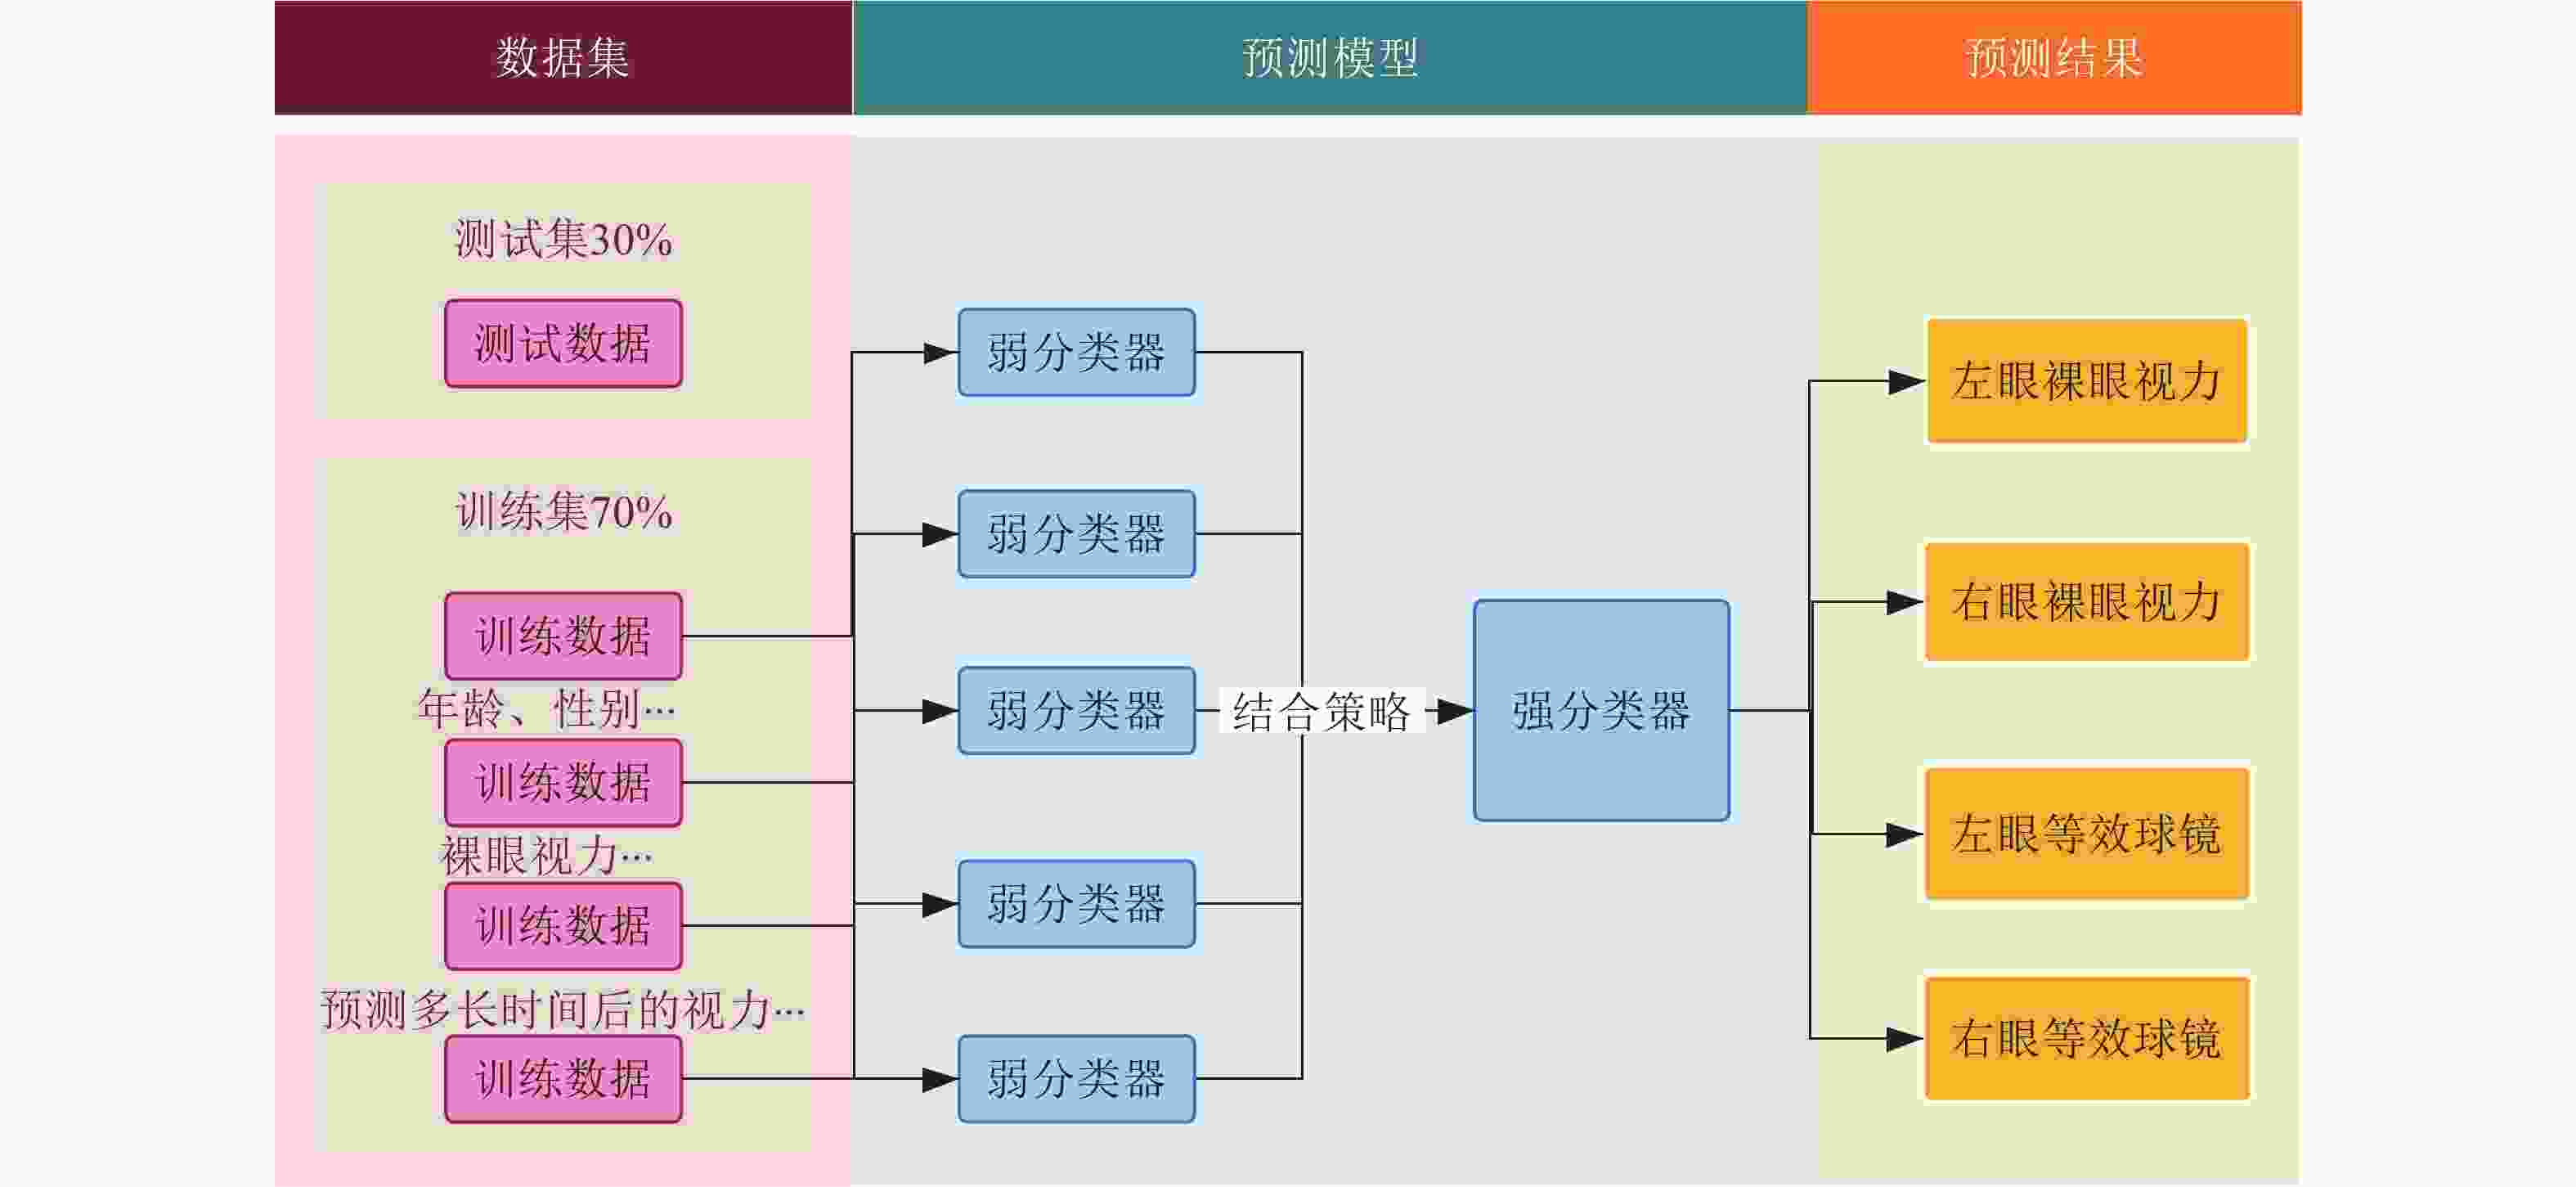
图 5 预测模型结构
如表1所示,随机森林方法和梯度提升方法的误差相对最低,但梯度提升方法在间隔时间较长之后,会出现结果突变和失稳,特别是突然出现视力大幅度变好的情况,而这与医学实践知识是不符合的,也没有在其他具有更长时间间隔的真实数据中观察到。因此,综合考虑算法的精确性和鲁棒性,我们认为随机森林是最好的模型,而如果只预测较短时间之内的视力变化情况(如半年之内),则梯度提升方法效果也很好。如果用随机森林算法,只对下一个时间点“是否是近视”进行预测,则准确度可以达到92.8%。
表 1 不同模型预测误差对比
模型 误差 右眼裸眼视力 左眼裸眼视力 右眼等效球镜 左眼等效球镜 随机森林 0.111 0.120 0.379 0.387 梯度提升 0.115 0.118 0.368 0.364 极端梯度提升 0.132 0.132 0.379 0.387 装袋 0.119 0.123 0.381 0.396 自适应提升 0.147 0.125 0.396 0.374 -
本文分析结果显示中国青少年近视发生率远远超过国际水平,其中8~12岁是近视新增的高发时期,平均每年约有20%的非近视学生转为近视学生,而10~14岁是高度近视新增的危险时期。父母近视情况和户外活动时间对近视形成的影响最大。本文还构建了一个仅需单次检查数据即可得出未来视力预测结果的模型,可以定量给出未来指定时间点的左右眼裸眼视力及左右眼等效球镜值,可以据此进行近视及近视程度的预测。如果只对近视与否进行判断,预测准确度接近93%,有相当的参考价值。
结合影响因素的分析,本文认为我国青少年近视率远高于世界平均水平的一个很重要的原因,就是课后户外活动时间严重不足,这可能归因于中国孩子从小课业压力过大。根据数据分析结果,本文建议应尽量保障每个孩子平均每天在校园外有2 h的户外活动时间,在非周末也应该每天至少1 h以上的户外活动时间。在8~12岁近视转化率是最高的,这个时间点恰好在小学阶段,如果教育部门能够持续有力地推动素质教育,降低考试成绩在小学学习过程中的重要性,学校和家长就能够更从容主动保障孩子的户外活动时间,降低近视发生率。如果孩子在小学阶段视力很好,后面转为近视的风险会相应降低。
本研究的数据还具有明显的局限性,缺少6岁以下以及14岁以上的数据,样本区域集中代表性不充分,在国内还没有大规模针对家庭情况和生活习惯的调查。这使得本文结论的适用度和可信度都有相当大可提高的空间,特别是无法准确判断海外数据(数据集C)对中国情况的解释力——这还需要针对国内类似调查数据的分析。目前研究组正在进行针对数十万青少年的视力筛查,并匹配对数万抽样家长的问卷调查,有望在近期给出更充分全面的分析。
青少年近视防控是一项系统工程,需要政府、学校、医疗卫生机构、家庭和学生本人共同努力。政府应该主动出台近视防控计划,每3~5年为一期,给出明确的目标和可操作的方案,并通过广覆盖的筛查数据分析获得定量化的反馈,切实有效地提升青少年视力水平。
Myopia Contributing Factors and Myopia Prediction Based on Vision Examination Data
-
摘要: 该文分析了国内外近视检查数据,统计结果显示中国青少年近视发生率远远超过国际水平,其中8~12岁是近视新增的高发时期,平均每年约有20%的非近视学生转为近视学生,而10~14岁是高度近视新增的危险时期。此外,父母近视情况和户外活动时间对近视形成的影响最大,高于电脑使用时间和看电视时间的影响。该文采用5种集成学习方法对未来视力情况进行预测,综合考虑鲁棒性和精确度,随机森林模型预测效果最好,其中近视的预测准确率在70%训练集、30%测试集划分的情况下为92.8%。Abstract: This paper analyzes myopia examination data at home and abroad. Statistics show that the incidence of myopia in Chinese adolescents far exceeds the international adolescents. 8 to 12 years old is a period when the number of myopia is increasing rapidly. About 20% of non-myopia students turn into myopia students every year in this period. The age of 10 to 14 is a dangerous period of suffering from high myopia. Time for outdoor activities and parents’ myopia have the greatest impact on the occurrence of myopia, higher than that of the time spent on computer and the time spent on watching TV. This paper uses five ensemble learning methods to predict people’s future vision. Considering the robustness and accuracy, the random forest model has the best prediction effect. The prediction accuracy of myopia is 92.8% in the case of 70% training set and 30% test set.
-
Key words:
- ensemble learning /
- myopia /
- prediction /
- random forest
-
表 1 不同模型预测误差对比
模型 误差 右眼裸眼视力 左眼裸眼视力 右眼等效球镜 左眼等效球镜 随机森林 0.111 0.120 0.379 0.387 梯度提升 0.115 0.118 0.368 0.364 极端梯度提升 0.132 0.132 0.379 0.387 装袋 0.119 0.123 0.381 0.396 自适应提升 0.147 0.125 0.396 0.374  下载: 导出CSV
-
[1] HOLDEN B A, FRICKE T R, WILSON D A, et al. Global prevalence of myopia and high myopia and temporal trends from 2000 through 2050[J]. Ophthalmology, 2016, 123(5): 1036-1042. [2] 中华人民共和国国家卫生健康委员会宣传司. 儿童青少年总体近视率为53.6%我国将更有针对性地开展近视干预[EB/OL]. (2019-5-18). [2020-10-20]. http://www.nhc.gov.cn/xcs/s7847/201905/11c679a40eb3494cade977f65f1c3740.shtml. [3] World Health Organization. The impact of myopia and high myopia[EB/OL]. (2015-03-16). [2020-10-20]. https://www.who.int/blindness/causes/MyopiaReportforWeb.pdf. [4] ZADNIK K, SINNOTT L T, COTTER S A, et al. Prediction of juvenile-onset myopia[J]. JAMA Ophthalmol, 2015, 133(6): 683-689. doi: 10.1001/jamaophthalmol.2015.0471 [5] MUTTI D O, SINNOTT L T, MITCHELL G L, et al. Relative peripheral refractive error and the risk of onset and progression of myopia in children[J]. Invest Ophthalmol Vis Sci, 2011, 52(1): 199-205. doi: 10.1167/iovs.09-4826 [6] SAW S M, SHANKAR A, TAN S B, et al. A cohort study of incident myopia in Singaporean children[J]. Invest Ophthalmol Vis Sci, 2006, 47(5): 1839-1844. doi: 10.1167/iovs.05-1081 [7] TONG L, CHAN Y H, GAZZARD G, et al. Longitudinal study of anisometropiain Singaporean school children[J]. Invest Ophthalmol Vis Sci, 2006, 47(8): 3247-3252. doi: 10.1167/iovs.05-0906 [8] OJAIMI E, ROSE K A, SMITH W, et al. Methods for a population-based study of myopia and other eye conditions in school children: the Sydney myopia study[J]. Ophthalmic Epidemiol, 2005, 12(1): 59-69. doi: 10.1080/09286580490921296 [9] 马莹琰. 上海儿童近视流行及预测相关研究[D]. 上海: 上海交通大学, 2016. MA Ying-yan. Epidemiolgical studies of myopia in shanghai children and relevant methods for myopia prediction[D]. Shanghai: Shanghai Jiao Tong University, 2016. [10] MA Ying-yan, ZOU Hai-dong, LIN Sen-lin, et al. Cohort study with 4-year follow-up of myopia and refractive parameters in primary schoolchildren in Baoshan district, Shanghai[J]. Clin Exp Ophthalmol, 2018, 46(8): 861-872. doi: 10.1111/ceo.13195 [11] LI Shi-ming, LI He, LI Si-yuan, et al. Time outdoors and myopia progression over 2 years in Chinese children: The Anyang childhood eye study[J]. Invest Ophthalmol Vis Sci, 2015, 56(8): 4734-4740. doi: 10.1167/iovs.14-15474 [12] HE Ming-guang, ZENG Jun-wen, LIU Yi-zhi, et al. Refractive error and visual impairment in urban children in southern china[J]. Invest Ophthalmol Vis Sci, 2004, 45(3): 793-799. doi: 10.1167/iovs.03-1051 [13] 张加裕, 王强, 林思思, 等. 温州地区7~14岁儿童近视眼患病率和眼轴及其相关因素分析[J]. 中华眼科杂志, 2016, 52(7): 514-519. ZHANG Jia-yu, WANG Qiang, LIN Si-si, et al. Analysis of myopia and axial length changes and relevant factors of children aged 7 to 14 years in Wenzhou[J]. Chinese Journal of Ophthalmology, 2016, 52(7): 514-519. [14] 元力, 万博, 鲍永珍. 近视眼人群屈光状态与主视眼的相关性研究[J]. 中华眼科杂志, 2020, 56(9): 693-698. YUAN Li, WAN Bo, BAO Yong-zhen. Association between ocular dominance and refraction in myopic subjects[J]. Chinese Journal of Ophthalmology, 2020, 56(9): 693-698. [15] GIANNATOU E. Myopia study, statistics for business analytics II[EB/OL]. [2017-02-01]. https://github.com/evagian/Myopia-Study-classification-logistic-regression-R. [16] ZADNIK K, FRIEDMAN N E, QUALLEY P A, et al. Ocular predictors of the onset of juvenile myopia[J]. Invest Ophthalmol Vis Sci, 1999, 40(9): 1936-1943. [17] HOSMER D W, LEMESHOW S, STURDIVANT R X. Applied logistic regression[M]. The 3rd ed. [S.l.]: John Wiley & Sons Inc, 2013. [18] JONES-JORDAN L A, MANNY R E, COTTER S A, et al. Early childhood refractive error and parental history of myopia as predictors of myopia[J]. Invest Ophthalmol Vis Sci, 2010, 51: 115-121. doi: 10.1167/iovs.08-3210 [19] FRENCH A N, MITCHELL P, ROSE K A. Risk factors for incident myopia in Australian schoolchildren: the Sydney adolescent vascular and eye study[J]. Ophthalmology, 2013, 120(10): 2100-2108. doi: 10.1016/j.ophtha.2013.02.035 [20] LIN Hao-tian, LONG E, DING Xiao-hu, et al. Prediction of myopia development among Chinese school-aged children using refraction data from electronic medical records: A retrospective, multicentre machine learning study[J]. PLOS Medicine, 2018, 15(11): 1-17. [21] COX D R. The regression analysis of binary sequences[J]. Journal of the Royal Statistical Society: Series B (Methodological), 1958, 20(2): 215-232. doi: 10.1111/j.2517-6161.1958.tb00292.x [22] SPEARMAN C. The proof and measurement of association between two things[J]. Am J Psychol, 1904, 15(1): 72-101. doi: 10.2307/1412159 [23] KAM H T. Random decision forest[C]//Proceedings of the 3rd International Conference on Document Analysis and Recognition. Montreal, Canada: [s.n.], 1995, 1416: 278-282. [24] FREUND Y, SCHAPIRE R E. A decision-theoretic generalization of on-line learning and an application to boosting[J]. Journal of Computer and System Sciences, 1997, 55(1): 119-139. doi: 10.1006/jcss.1997.1504 [25] BREIMAN L. Bagging predictors[J]. Machine Learning, 1996, 24(2): 123-140. [26] FRIEDMAN J H. Greedy function approximation: A gradient boosting machine[J]. Annals of Statistics, 2001: 1189-1232. [27] FRIEDMAN J H. Stochastic gradient boosting[J]. Computational Statistics & Data Analysis, 2002, 38(4): 367-378. [28] CHEN T, GUESTRIN C. Xgboost: A scalable tree boosting system[C]//Proceedings of the 22nd ACM Sigkdd International Conference on Knowledge Discovery and Data Mining. [S.l.]: ACM, 2016: 785-794. -

 点击查看大图

图(5) / 表(1)
计量
- 文章访问数: 6090
- HTML全文浏览量: 1918
- PDF下载量: 76
- 被引次数: 0