The Equilibrium Property in Scientific Collaborations
-
摘要: 本文采用正三角形映射的方法对科学家之间的合作关系模式进行了实证分析。这一方法基于科研合作网络数据,把每个科学家同其近邻的3个满足给定条件的高影响力科学家,根据合作关系疏密,映射到一个标准正三角形上。根据他们在映射三角形中的映射位置分布,来测定其合作关系模式。研究发现,科学家在映射三角形上的分布呈现出中心集聚趋势,说明科学家的合作关系常常较为均匀地散布在多个高影响力合作对象之间,其关系模式呈现出较强的均衡性特征。本文所分析的4个研究领域均在全参数空间内呈现这一特征,而科学家的学术年龄、被引次数差异等因素均不影响该特征的表达。进一步分析发现这种均衡性特征对科学家的科研影响力的影响以负面为主。这一研究为分析科学家之间的合作关系模式以及各类复杂网络的节点关系提供了新的视角。Abstract: This paper uses the method of regular-triangle mapping to empirically analyze the collaboration between scientists. Based on the data of scientific collaboration networks, each scientist is mapped to a standard regular triangle based on the collaboration relationship with three nearest higher-influence scientists who satisfy a type of given condition. The modes of their relationship can be shown by the pattern of their mapping position in the regular triangle. We find that the distribution of scientists on the mapping triangle shows obvious center-gathering tendency, indicating the strong equilibrium property that the collaboration of scientists is often evenly distributed among multiple collaboration partners with higher-influence. This property can be observed in the full parameter space of all of the four research topics discussed in this paper, and the academic age, the difference in total citations and some other factors do not efficiently impact the expression of the equilibrium property. Furthermore, we find that the impact of the equilibrium property on the scientific influence of scientists mainly is negative. This research provides a new perspective for analyzing the pattern of collaboration relationships between scientists and the node relationships of various complex networks.
-
伴随着科研数据的积累和网络数据分析手段的不断深化,建立在科研大数据基础上的“科学学”研究已经成为近年来的热点领域[1-7]。其中,由于科研合作网络是科研活动组织、科学信息传播等方面的结构基础,深刻影响到科学家的科研工作,因此它一直是该领域研究的重要议题之一[8-13]。当前对科研合作网络的研究主要集中在如下3个方面:1)科研合作网络的各类宏观结构特性挖掘[14-17],如团簇性、社团结构等及这些结构特性的生成与演化过程[18-19];2)科研合作关系的结构特性对科研产出和科研影响力的影响和预测[20-24],如阶数中心性效应、强弱关系影响等;3)微观层面上对团队结构特性及影响的挖掘[19, 25-27],如对科研团队化的趋势挖掘和团队规模及协作性的演变等。这些研究已经大大深化了对科研合作关系的认知。
一般而言,科学家之间的合作关系常常并非是完全对等的,一些情况下存在对特定科学家或科学团体的偏依。然而,除了部分涉及偏好依附机制的研究,当前对这种非对等性的识别和挖掘仍然相对不足。本文着眼于科学家个体的合作关系在其科研合作网络上的分布特性,重点讨论其合作关系是否存在对其他科学家个体的直接或者间接性的偏倚。针对这一问题,提出了一种基于正三角形映射的社会关系模式分析方法,来对科学家的合作关系模式进行研究。统计分析表明,从总体上看,科学家们在其研究生涯的各个阶段,其合作关系模式均显露出较为强烈的均衡性特征。
1. 数据介绍
首先对本文分析所用数据集进行介绍。数据集得自于微软知识图谱数据库(Microsoft academic graph)所提供的API接口(Microsoft cognitive services academic knowledge API)[28]。根据数据集所标注的论文领域标志,本文爬取了其中的复杂网络(领域标志为complex network,包含1988年~2018年的24 028篇论文,共36 260位作者)、深度学习(领域标志为deep learning,包含1986~2018年的25 134篇论文,共52 774位作者)、大众传媒(领域标志为mass media,包含1952~2018年的65 049篇论文,共90 416位作者)、社交网络(领域标志为social network,包含1950~2018年的141 932篇论文,共204 880位作者)4个领域的论文信息。论文数据包含了论文的ID、领域标志、作者信息、发表时间、被引用数等,其中作者信息中包含了作者姓名、作者ID、作者所在机构等信息。
2. 最近邻映射三角形方法
一般而言,通过与更高水平的学者进行合作来进一步提升自身研究工作的水平,是科学家进行科研合作选择的主要模式之一。在合作过程中,可以观察到两类情况:一种是长期只同某一位高影响力科学家保持紧密的合作关系,本文定义这种情况为,该科学家的合作关系偏依于这位高影响力科学家;相反,如果其合作关系较为均匀地散布在多位高影响力科学家中,即可认为该科学家的合作关系呈现出较高的均衡性。在识别这种偏倚性方面,文献[29]提出了一种针对城市经济地理分布研究的标准化变换方法,通过把各个城市根据它们的经济关系和地理位置投影到一个标准正三角形上,来刻画城市经济结构中的均衡性与偏依性。本文把这一方法推广到对网络结构的分析上。该方法描述如下:
首先对各个研究领域,把各个论文作者作为该网络的节点,不同作者之间的合作关系表示为网络的边,作者之间合作论文数目作为网络中边的权值,这样构建起该领域的一个无向含权的科研合作网络。这里为了保证后续分析所需定义的科研年龄的有效性,网络中只采用发表论文总篇数不小于2的节点。为了保证网络连通性,取其最大连通子图作为分析对象。然后展开如下步骤:
1) 计算每一对节点(科学家)之间的节点距离。计算中,定义相邻节点的距离为其连边权重的倒数,记为d。任意一对节点的距离被定义为,从此节点出发,沿网络的边到达另一节点所经过的路径中,所经各边的d值之和最小的路径。
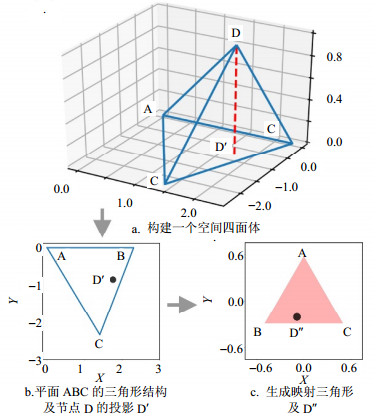
2) 对每个节点(如节点D),在该领域的网络中寻找到所有的影响力(用该科学家在该领域的总被引用次数表示)高于该节点的节点,从这些较高影响力节点中找到3个距离该节点最近的,并根据总引用次数由高到低将其排序(如节点A、B、C)。这样,这3个距该节点最近的高影响力节点,根据同该节点的距离关系,构建出一个空间四面体(如果A、B、C、D四点之间的距离关系不能构成空间四面体结构,则忽略节点D)。四面体ABCD的空间坐标确定方法如下:首先根据步骤1)中节点间距离关系得到节点AB、AC、BC、DA、DB、DC的距离分别记作dAB、dAC、dBC、dDA、dDB、dDC。以节点A为空间直角坐标系原点,固定节点A、B的空间坐标分别为(0, 0, 0)、(dAB, 0, 0),节点C空间坐标可由下式得出:
$$\left\{ \begin{array}{l} x_{\rm{C}}^2 + y_{\rm{C}}^2 - d_{{\rm{AB}}}^2 = 0 \\ {{\rm{(}}{x_{\rm{C}}} - {d_{{\rm{AB}}}}{\rm{)}}^2} + y_{\rm{C}}^2 - d_{{\rm{BC}}}^2 = 0 \\ {z_{\rm{C}}} = 0 \\ \end{array} \right.$$ (1) 节点D的空间坐标计算如下:
$$\left\{ \begin{array}{l} x_{\rm{D}}^2 + y_{\rm{D}}^2 + z_{\rm{D}}^2 = d_{{\rm{DA}}}^2 \\ {{\rm{(}}x_{\rm{D}}^{} - x_{\rm{B}}^{}{\rm{)}}^2} + y_{\rm{D}}^2 + z_{\rm{D}}^2 = d_{{\rm{DB}}}^2 \\ {{\rm{(}}x_{\rm{D}}^{} - x_{\rm{C}}^{}{\rm{)}}^2} + {{\rm{(}}y_{\rm{D}}^{} - y_{\rm{C}}^{}{\rm{)}}^2} + z_{\rm{D}}^2 = d_{{\rm{DC}}}^2 \\ \end{array} \right.$$ (2) 如图 1a所示。
3) 在该空间四面体中,确定出节点D在节点A、B、C所确定的平面内的投影D',如图 1b。
4) 把以节点A、B、C为顶点的三角形变换为正三角形,并确定出在正三角形中D'的相应位置。这一变换算法为,将A、B、C三点的位置,依次投影到一个边长为1的正三角形的3个顶点(0, $\sqrt 3 /3$)、(–1/2, $\sqrt 3 /6$)、(1/2, $\sqrt 3 /6$)上。此时,节点A、B、C的位置坐标Si(i=A, B, C)和它们在该正三角形中的映射位置坐标S'i满足映射关系:
$$ \boldsymbol{S}_{i} \boldsymbol{M}=\boldsymbol{S}_{i}^{\prime} $$ (3) 式中,M为仿射变换矩阵,可由这3个节点的变换前后的坐标计算得出。进一步,根据所得仿射变换矩阵M,可计算出节点D在正三角形中的映射位置:D"=D'M,其中D'为节点D在平面ABC上的投影D'的位置。这里之所以映射到正三角形,是因为三角形变换所需的邻边信息最少,而且可以保证图形一定是凸多边形,可避免方位重叠带来的影响力区分困难,如图 1c所示。
为了更清晰地说明这一计算过程,下面举一具体实例如下:
假设节点A、B、C、D之间的距离关系分别为:dAB =2.30、dAC =2.72、dBC =2.50、dDA =2.06、dDB =1.21、dDC =1.66。以节点A做为空间直角坐标系原点,B点位于x轴上,C点位于平面z=0上,则B点的坐标为B(2.30, 0, 0)。根据式(1)和(2),得到C、D两点的空间坐标为C(1.40, -2.33, 0)、D(1.75, -0.85, 0.68)。然后根据步骤3),计算D在平面ABC上的投影D'的坐标为(1.75, -0.85),如图 1b所示。
根据步骤4),如图 1c所示,为了将ABC映射为正三角形,记A(0, 0, 1)、B(2.30, 0, 1)、C(1.40, -2.33, 1)、D'(1.75, -0.85, 1)。仿射变换矩阵M形式为$\left( {\begin{array}{*{20}{c}} a&d&0 \\ b&e&0 \\ c&f&1 \end{array}} \right)$,其中元素a, b, …, f为未知数。根据A、B、C映射前后的坐标,由式(3)计算可得矩阵M为$\left( {\begin{array}{*{20}{c}} { - 0.217}&{ - 0.376}&0 \\ { - 0.344}&{0.145}&0 \\ 0&{0.577}&1 \end{array}} \right)$。再根据D'的坐标,可由式(3)得到D"在正三角形的投影坐标为(-0.09,-0.20),如图 1c所示。
这一方法,把科学家与其学术合作关系中最为密切的3个影响力超过其自身的学者的关系变换为一种可以直接比较的标准形式。如果该科学家高度偏依于这3位学者中某一位的合作,那么其映射位置将趋向于正三角形的三角之一;如果同这3位学者的合作关系不存在特殊的倾向性,则其映射位置趋近于正三角形中心区域,表示该科学家的合作关系模式具有较高的均衡性。需要注意的是,这一分析方法并没有区分直接的和间接的合作关系。
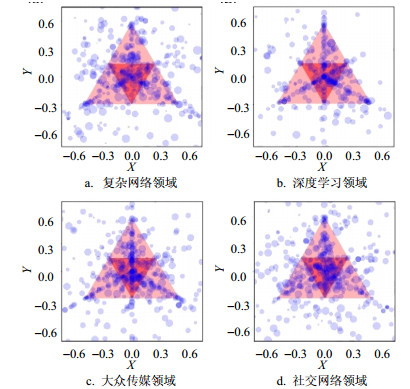
经过上述三角形映射后,各个节点在各领域的映射三角形内的相对位置如图 2所示。可以发现,节点在正三角的中心区域与三边中垂线附近分布最为密集。本文通过分布在三角形中心区域内(即如图 2所示的深色三角形区域,其3个顶点分别为正三角形的三边中点)的节点,占三角形内总节点数的比例q,来描述科学家在正三角形中心附近的分布集中程度,如表 1所示。可以看出,三角形内大部分节点分布在中心区域中。
表 1 各领域科学家的映射三角形分析领域 中心区域点数 映射三角形内总点数 q值 < q0 > P(q0 > q) 复杂网络 5 444 8 126 0.67 0.44 0.001 深度学习 5 647 7 954 0.71 0.56 0.006 社交网络 12 427 16 794 0.74 0.52 0.001 大众传媒 5 258 6 742 0.78 0.61 0.004 为了检验这一集中趋势的显著性,本文构建了零模型[30]与之比较。零模型的构建方法是,将网络中各节点的总被引次数进行随机互换,然后对互换后的网络重新根据上述方法构建最近邻映射三角形,并计算每个点在新构的映射三角形上的映射位置,统计节点在新构映射三角形中心区域的比例(用q0表示),并计算重复性随机构建零模型时出现q0 > q的概率P(q0 > q)。P(q0 > q)表示的是随机零模型中出现中心集中趋势比实际统计更强的极端情况的概率,其含义等价于统计显著性P值,越低越表示中心集中趋势的显著。为了计算这一概率,本文对每个领域重复随机构建零模型103次,观察出现q0 > q的次数,计算结果如表 1所示,其P(q0 > q)均小于0.01,说明该中心集中趋势是显著的,暗示出科学家合作关系常常较为均匀地散布在多个较高影响力合作对象上,呈现出较强的均衡性特征。
3. 合作关系模式的变化趋势
为了进一步挖掘科学家对具有不同影响力的近邻的关系模式的异同,本文定义了一个非负的阈值μ。它表示,对于某个科学家D,在构建其映射三角形时,三个角所对应的邻近的高影响力科学家(例如图 1中的A、B、C),其总被引次数必须大于D的总被引次数的μ倍。因此,上文中所计算的映射三角形,所对应的是μ=1的情况。
同时,考虑到不同的科研经历对科学家合作关系模式可能也有深刻影响,本文通过科研年龄对各个学科的科学家进行了筛选。这里,科学家的科研年龄a所指的是,从该科学家在该研究领域内的第一篇论文发表,到该领域中其最后一篇论文发表的年份间隔。在筛选时,选出科研年龄不小于年龄阈值a的科学家作为分析对象,根据阈值μ构建每个科学家的映射三角形。在筛选过程中,把科研年龄不足的科学家全部移除,用剩余科学家信息重新构建科研合作网络,然后提取各领域的最大连通子图作为分析的目标网络。图 3展示了各个领域在不同阈值μ值时,科研年龄不小于a的科学家在其在其映射三角形的分布,均呈现较明显的中心聚集趋势。
进一步,本文计算了阈值μ取不同值时的三角形中心区域节点数比例q,并同相应μ值时的零模型进行比较。同时,还计算了在具有相同的μ值和不同的年龄阈值a时,实际的q值和零模型q0值的均值< q0 > 随阈值μ的变化曲线,以及相应的极端情况概率P(q0 > q)的曲线。在这里,极端情况概率P(q0 > q)可以作为中心聚集特性的度量,其值越小,说明中心聚集特性越显著。如图 4所示,所分析的4个研究领域,在阈值μ为0~3.0的区间内,其q值均大于 < q0 > 。当μ > 1.0时,复杂网络和大众传媒领域所对应P(q0 > q)值均小于0.05,呈现出显著的中心聚集特性;深度学习和社会网络领域的P(q0 > q)值也均小于0.5,显示以中心聚集特性为主。这暗示着,尽管科学家之间有着大量的科研合作,但是从整体上看,不论近邻的影响力怎样,他们的合作网络往往较为均匀地散布在周围多个高影响力科学家的圈子中,其合作关系模式往往显现较强的均衡性特征,而没有出现具有显著偏依性的区间。这一全区间范围内的均衡性特征,不同于文献[29]所观察到的城市经济关系中小城市对大城市的强偏依性。
同时,不同总被引用水平的科学家所显示出的均衡性强弱有所不同。在科研年龄阈值a筛选结果的基础上,再筛选出总被引次数不小于被引用数阈值nc的科学家作为分析对象。图 4h、图 4l和图 4p显示出,总被引次数较高的科学家,其P(q0 > q)值曲线位置也相对较高,显示出较高影响力的科学家虽然依然存在较强的均衡性,但相对于低影响力科学家,他们的均衡性有所减弱。
进一步,为了挖掘这种均衡性与科研影响力的关系,本文比较了位居映射三角形不同区域的科学家的科研产出差异。定义v值为,三角形中心区域的节点的平均被引用次数与映射三角形内其他区域的节点的平均总被引用次数的比值。计算了v值在a-μ空间中的分布,如图 5所示,其中,v = 1.0的等v线用实线表示;μ = 1.0用虚线标出。不同学科该分布各不相同。在μ≥1.0时(此时正三角形的三角所对应节点的影响力都大于所讨论节点),除了深度学习领域,其他3个领域在绝大部分情况下其v值是明显小于1的,意味着三角形中心区域的节点的平均总被引用次数往往相对较低。这一结果暗示出,这种均衡性在科学家影响力的提升方面可能存在负面影响,较为成功的科学家更可能呈现出一定的偏依性。考虑到近期关于职业成功的研究揭示出已成功的中心个体对后来者的巨大促进作用[31-32],可以对这一结果做出以下理解:取得较高影响力的学者,可能有着更多的同某个具有更高影响力的学者进行长期合作的经历,从而显露出更强的偏依性;而在占据大多数的合作较为均衡的个体中,其多数可能缺乏同高影响力学者进行长期稳定合作的经历,制约了其自身的影响力的提升。
4. 结束语
总而言之,本文所采用的映射三角形方法,其实质是把科学家的合作关系投影到一个可供直接比较的标准化空间中,通过他们在该空间中的分布特性来挖掘他们的合作关系模式。分析发现,对于大多数科学家,其合作关系常常较为均匀地分布在多个更高影响力合作对象之上,而非长期地集中在某个高影响力学者身上。这一特性迥异于在城市经济关系中发现的偏依特征,反映出,尽管众多研究团队采取了以少数高影响力学者为核心的结构模式,大多数科学家在布局合作关系时依然体现出较强的均衡性,并不容易被学术团队的少数核心成员所支配。此外,更进一步的分析还显示出,在大多数情况下这种均衡性并没有能够促进科学家影响力的提升,暗示出同个别高影响力学者进行长期稳定合作或者接受高影响力学者的领导的重要性。本文研究还表明,这类基于正三角形变换的分析方法,在挖掘网络节点间的关系模式方面具有较为普遍的适用性。
-
表 1 各领域科学家的映射三角形分析
领域 中心区域点数 映射三角形内总点数 q值 < q0 > P(q0 > q) 复杂网络 5 444 8 126 0.67 0.44 0.001 深度学习 5 647 7 954 0.71 0.56 0.006 社交网络 12 427 16 794 0.74 0.52 0.001 大众传媒 5 258 6 742 0.78 0.61 0.004 -
[1] CLAUSET A, LARREMORE D B, SINATRA R, et al. Data-driven predictions in the science of science[J]. Science, 2017, 355(6324):477-480. DOI: 10.1126/science.aal4217
[2] FORTUNATO S, BERGSTROM C T, BORNER K, et al. Science of science[J]. Science, 2018, 359(6379):10.1126/science.aao0185. http://d.old.wanfangdata.com.cn/OAPaper/oai_doaj-articles_23ae6bc06c68487d68bb8a6af85a4f56
[3] ZENG A, SHEN Z, ZHOU J, et al. The science of science:From the perspective of complex systems[J]. Physics Reports, 2017(714):1-73. http://cn.bing.com/academic/profile?id=fbe44c544b97f6f9f8e4a797ab86c4f8&encoded=0&v=paper_preview&mkt=zh-cn
[4] STALLINGS J, VANCE E A, YANG J, et al. Determining scientific impact using a collaboration index[J]. Proceedings of the National Academy of Sciences of the United States of America, 2013, 110(24):9680-9685. DOI: 10.1073/pnas.1220184110
[5] WALTMAN L. A review of the literature on citation impact indicators[J]. Journal of Informetrics, 2016, 10(2):365-391. DOI: 10.1016/j.joi.2016.02.007
[6] ZHANG J, NING Z, BAI X, et al. Exploring time factors in measuring the scientific impact of scholars[J]. Scientometrics, 2017, 112(3):1301-1321. DOI: 10.1007/s11192-017-2458-z
[7] STEGEHUIS C C, LITVAK N, WALTMAN L, et al. Predicting the long-term citation impact of recent publications[J]. Journal of Informetrics, 2015, 9(3):642-657. DOI: 10.1016/j.joi.2015.06.005
[8] AHUJA G. Collaboration networks, structural holes, and innovation:A longitudinal study[J]. Administrative Science Quarterly, 2000, 45(3):425-455. DOI: 10.2307/2667105
[9] NEWMAN M E J. Scientific collaboration networks I Network construction and fundamental results[J]. Physical Review E, 2001, 64(1):016131. DOI: 10.1103/PhysRevE.64.016131
[10] NEWMAN M E J. Scientific collaboration networks Ⅱ Shortest paths, weighted networks, and centrality[J]. Physical Review E, 2001, 64(1):016132. DOI: 10.1103/PhysRevE.64.016132
[11] RAMASCO J J, DOROGOVTSEV S N, PASTOR-SATORRAS R. Self-organization of collaboration networks[J]. Physical Review E, 2004, 70(3):036106. DOI: 10.1103/PhysRevE.70.036106
[12] ZHANG P P, CHEN K, HE Y, et al. Model and empirical study on some collaboration networks[J]. Physica A:Statistical Mechanics and Its Applications, 2006, 360(2):599-616. DOI: 10.1016/j.physa.2005.05.044
[13] ZHOU T, WANG B H, JIN Y D, et al. Modelling collaboration networks based on nonlinear preferential attachment[J]. International Journal of Modern Physics C, 2007, 18(2):297-314. DOI: 10.1142/S0129183107010437
[14] SCHILLING M A, PHELPS C C. Interfirm collaboration networks:The impact of large-scale network structure on firm innovation[J]. Management Science, 2007, 53(7):1113-1126. DOI: 10.1287/mnsc.1060.0624
[15] NEWMAN M E J. The structure of scientific collaboration networks[J]. Proc Natl Acad Sci USA, 2001, 98(2):404-409. DOI: 10.1073/pnas.98.2.404
[16] NEWMAN M E J. Coauthorship networks and patterns of scientific collaboration[J]. Proceedings of the National Academy of Sciences of the United States of America, 2004, 101(1):5200-5205. http://d.old.wanfangdata.com.cn/OAPaper/oai_pubmedcentral.nih.gov_387296
[17] PALLA G, BARABÁSI A, VICSEK T, et al. Quantifying social group evolution[J]. Nature, 2007, 446(7136):664-667. DOI: 10.1038/nature05670
[18] WANG W, YU S, BEKELE T M, et al. Scientific collaboration patterns vary with scholars' academic ages[J]. Scientometrics, 2017, 112(1):329-343. DOI: 10.1007/s11192-017-2388-9
[19] MILOJEVIC S. Principles of scientific research team formation and evolution[J]. Proceedings of the National Academy of Sciences of the United States of America, 2014, 111(11):3984-3989. DOI: 10.1073/pnas.1309723111
[20] WALLACE M L, LARIVIERE V, GINGRAS Y, et al. A small world of citations? The influence of collaboration networks on citation practices[J]. PLOS ONE, 2012, 7(3):e33339. DOI: 10.1371/journal.pone.0033339
[21] ABBASI A, HOSSAIN L, LEYDESDORFF L, et al. Betweenness centrality as a driver of preferential attachment in the evolution of research collaboration networks[J]. Journal of Informetrics, 2012, 6(3):403-412. DOI: 10.1016/j.joi.2012.01.002
[22] SARIGOL E, PFITZNER R, SCHOLTES I, et al. Predicting scientific success based on coauthorship networks[J]. EPJ Data Science, 2014, 3(1):9. http://www.wanfangdata.com.cn/details/detail.do?_type=perio&id=Arxiv000000977765
[23] PETERSEN A M. Quantifying the impact of weak, strong, and super ties in scientific careers[J]. Proceedings of the National Academy of Sciences of the United States of America, 2015, 112(34):4671-4680. DOI: 10.1073/pnas.1501444112
[24] JADIDI M, KARIMI F, LIETZ H, et al. Gender disparities in science? Dropout, productivity, collaborations and success of male and female computer scientists[J]. Advances in Complex Systems, 2018, 21(3-4):1750011. http://cn.bing.com/academic/profile?id=e2e67a0eb7cc9b5387f5d3a5bb3a538e&encoded=0&v=paper_preview&mkt=zh-cn
[25] WUCHTY S, JONES B F, UZZI B, et al. The increasing dominance of teams in production of knowledge[J]. Science, 2007, 316(5827):1036-1039. DOI: 10.1126/science.1136099
[26] MALMGREN RD, OTTINO J M, NUNES A L A. The role of mentorship in protégé performance[J]. Nature, 2010, 465(7298):622-626. DOI: 10.1038/nature09040
[27] LARIVIERE V, GINGRAS Y, SUGIMOTO C R, et al. Team size matters:Collaboration and scientific impact since 1900[J]. Journal of the Association for Information Science and Technology, 2015, 66(7):1323-1332. DOI: 10.1002/asi.23266
[28] Microsoft academic graph[DB/OL].[2018-02-03]. https://docs.microsoft.com/en-us/azure/cognitive-services/academic-knowledge/home.
[29] LIU P, HAN X P, LÜ L. Triangle-mapping analysis on spatial competition and collaboration of Chinese cities[C]//Conference of the Industrial Electronics Society.[S.l.]: [s.n.], 2017: 6012-6016.
[30] 尚可可, 许小可.基于置乱算法的复杂网络零模型构造及其应用[J].电子科技大学学报, 2014, 43(1):7-20. DOI: 10.3969/j.issn.1001-0548.2014.01.002 SHANG Ke-ke, XU Xiao-ke. Construction and application for null models of complex networks based on randomized algorithms[J]. Journal of University of Electronic Science and Technology of China, 2014, 43(1):7-20. DOI: 10.3969/j.issn.1001-0548.2014.01.002
[31] SINATRA R, WANG D, DEVILLE P, et al. Quantifying the evolution of individual scientific impact[J]. Science, 2016, 354(6312):10.1126/science.aaf5239. http://www.wanfangdata.com.cn/details/detail.do?_type=perio&id=2c7fd54f245cee1d5c6508307f1fa634
[32] FRAIBERGER S P, ROBERTA S R, RESCH M, et al. Quantifying reputation and success in art[J]. Science, 2018, 362(6416):825-829. DOI: 10.1126/science.aau7224
-
期刊类型引用(2)
1. 李明杰,岳昕晨,胡剑波,吴晔,闵勇,傅晨波. 新冠疫情下的国际科研合作研究. 电子科技大学学报. 2022(06): 928-936 .  本站查看
本站查看
2. 郭洋,谭春辉,王仪雯. 基于KMRW声誉模型的虚拟学术社区科研合作研究. 现代情报. 2020(12): 55-63 .  百度学术
百度学术
其他类型引用(1)

 ISSN
ISSN 


 下载:
下载:


